Amazon EKS ハンズオン for Fargate/Container Insights > [Option] Advanced > Service Mesh with Istio > Monitor & Visualize
Monitor & Visualize
Collecting new telemetry data
kubectl apply -f ${HOME}/environment/istio-${ISTIO_VERSION}/samples/bookinfo/telemetry/metrics.yaml
Make sure Prometheus and Grafana are running
kubectl -n istio-system get svc prometheus grafana
Open a new terminal tab and setup port-forwarding for Grafana by executing the following command
kubectl -n istio-system port-forward $(kubectl -n istio-system get pod -l app=grafana -o jsonpath='{.items[0].metadata.name}') 8080:3000
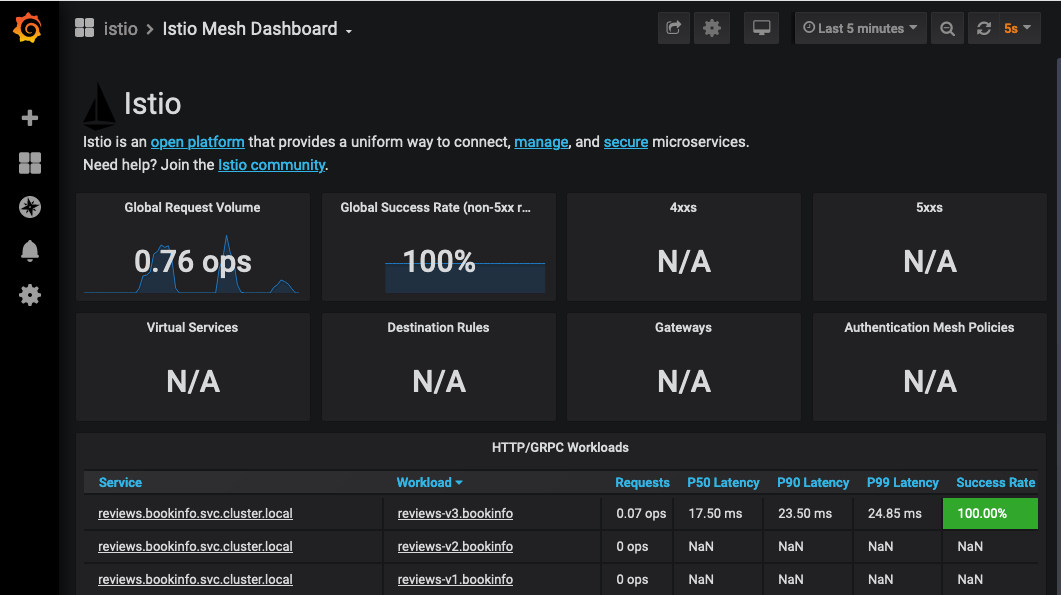
Open the Istio Dashboard via the Grafana UI
- In your Cloud9 environment, click Preview / Preview Running Application
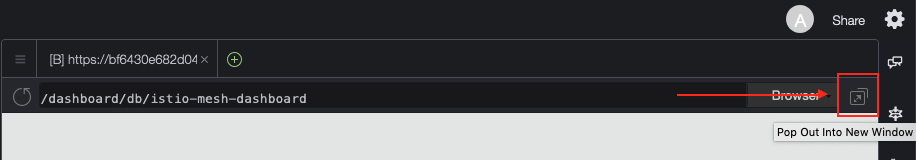
- Scroll to the end of the URL and append:
dashboard/db/istio-mesh-dashboard
- Click the ‘Pop Out Into New Window’ button
Open a new terminal tab and use these commands to send a traffic to the mesh
export GATEWAY_URL=$(kubectl -n istio-system get service istio-ingressgateway -o jsonpath='{.status.loadBalancer.ingress[0].hostname}')

watch --interval 1 curl -s -I -XGET "http://${GATEWAY_URL}/productpage"
You will see that the traffic is evenly spread between reviews:v1 and reviews:v3
We encourage you to explore other Istio dashboards that are available by clicking the Istio Mesh Dashboard menu on top left of the page, and selecting a different dashboard.